Some experiments with data exploration
This is a closer look at Tableau Frog, a project where I've been trying variable-driven charts and linked selections. There's a small interactive example below, followed by screenshots and notes from the app.
Try selecting a group
The example uses 2,000 synthetic signups. Drag a box in the scatter plot to select some of them, then watch how the other panels change. The colours compare that subset with the population; a statistical filter mutes some of the noisier differences.
Comparing the selection with the rest
The source panel keeps its original colours and marks the selection. The other panels show relative prevalence. In significant mode, a two-proportion z-test and Benjamini–Hochberg correction mute differences that don't pass the threshold. This is an exploratory aid, not evidence of a cause. Shift adds another condition; Esc clears the selection.
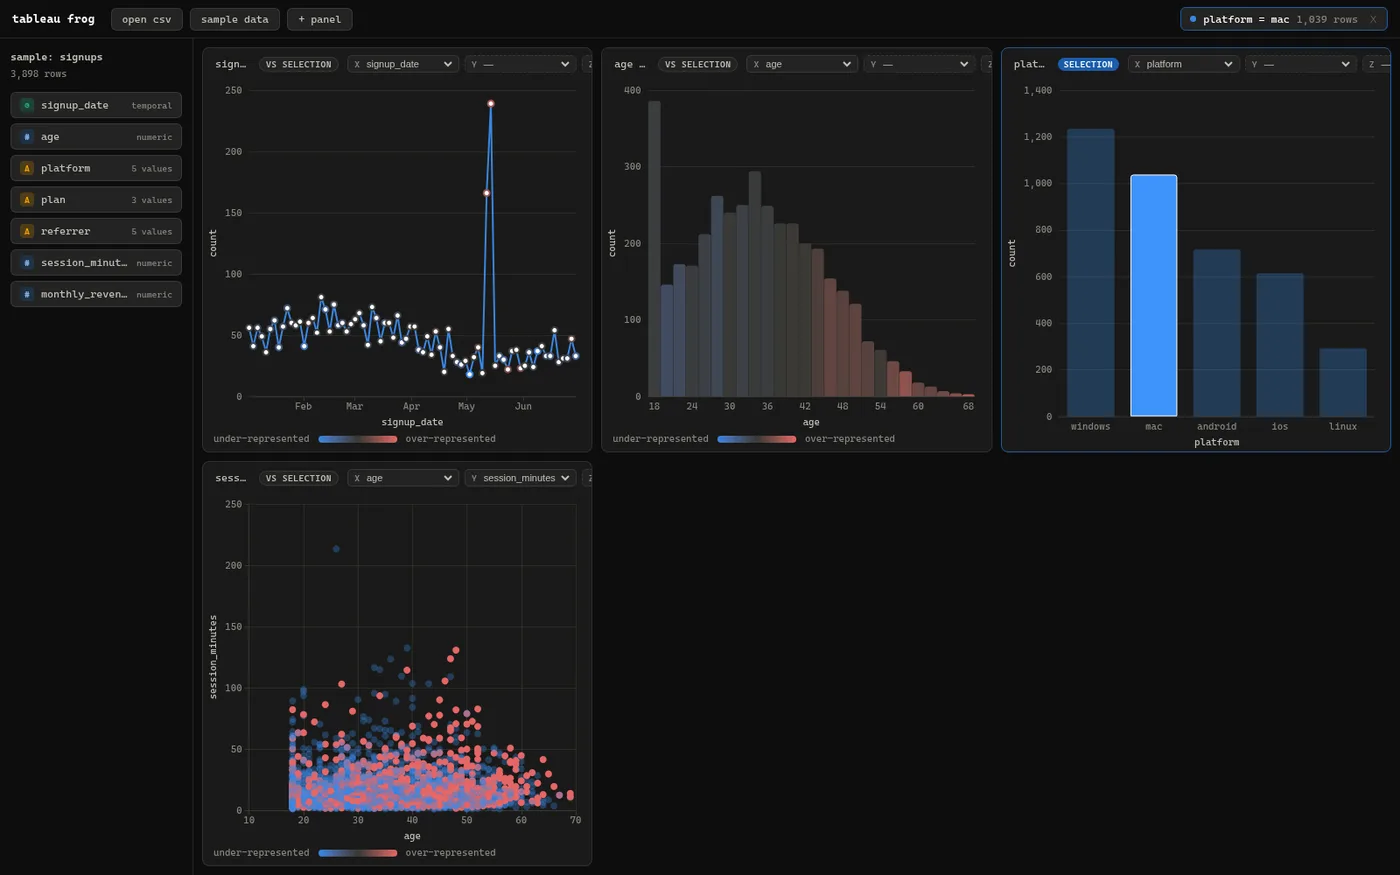
Some of the pieces in the app
Inferred charts
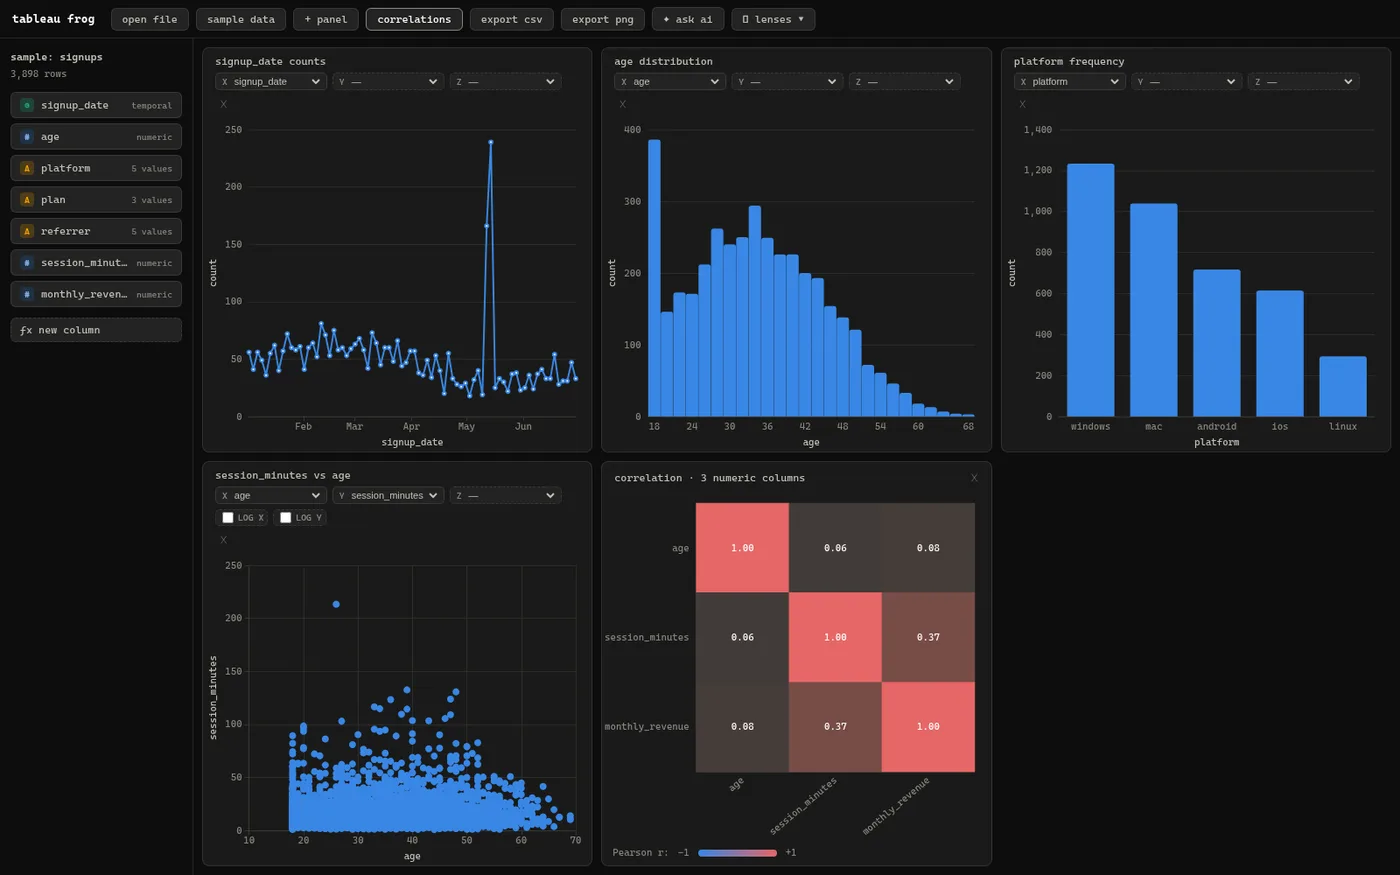
Assign columns to x, y and z. The app infers a chart from the types of those columns.
One global lens
Brush, click a bar, drag a lineX, click a crosstab cell — it all becomes one Selection. Shift composes with AND; the chip pops the newest clause; Esc clears all.
Statistical filtering
Significant mode uses a two-proportion z-test against the complement and Benjamini–Hochberg correction. Passing the threshold isn't a guarantee that a difference is important or causal.
Missing values, first-class
The sidebar shows ∅ counts; bar / crosstab / distribution render a selectable (missing) bucket; a missing selection makes null-ness itself a lens.
Command palette⌘⇧P
A fuzzy, validity-gated command list makes the app fully keyboard-drivable. Quick open (Ctrl+P) is a noun-first jump to a column, saved lens, or dataset — a leading > delegates to commands.
Derived columnsƒx
An eval-free expression engine: a hand-written tokenizer feeds a Pratt parser to a typed AST that compiles to a single linear pass over the columnar arrays — a 1M-row derive stays one scan.
Saved lenses
Name a selection, stash it per dataset, re-apply later — validated against the current schema, installed as a global lens so every panel renders it as contrast.
Correlation overview
A pairwise-complete Pearson-r heatmap over the numeric columns on a diverging visualMap pinned to r ∈ [-1, 1]; click a cell to spawn that scatter.
Plugin API + scripting
registerChartPlugin claims axis-type signatures ahead of built-in inference; everything is on window.tableauFrog for console-driven automation.
Questions to investigate
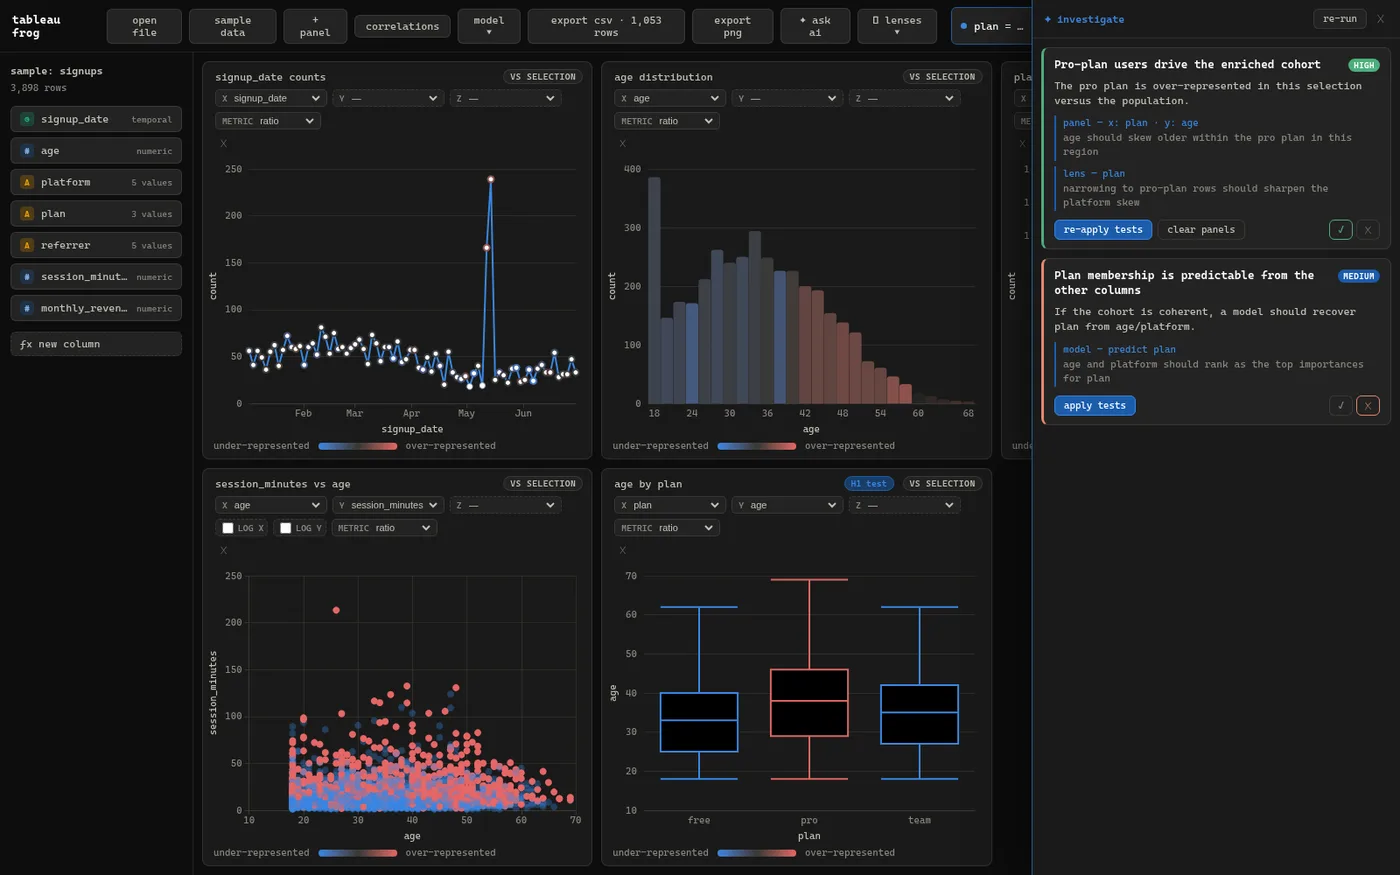
Investigate asks a model for possible explanations of a selection. Each suggestion includes a view or calculation to try. I can apply those suggestions and record a verdict with the dataset. The suggestions still need checking.
Brush → generate hypotheses
After selecting a group, Ctrl+I opens the hypothesis drawer. These screenshots show the proposed questions and the views suggested for checking them.
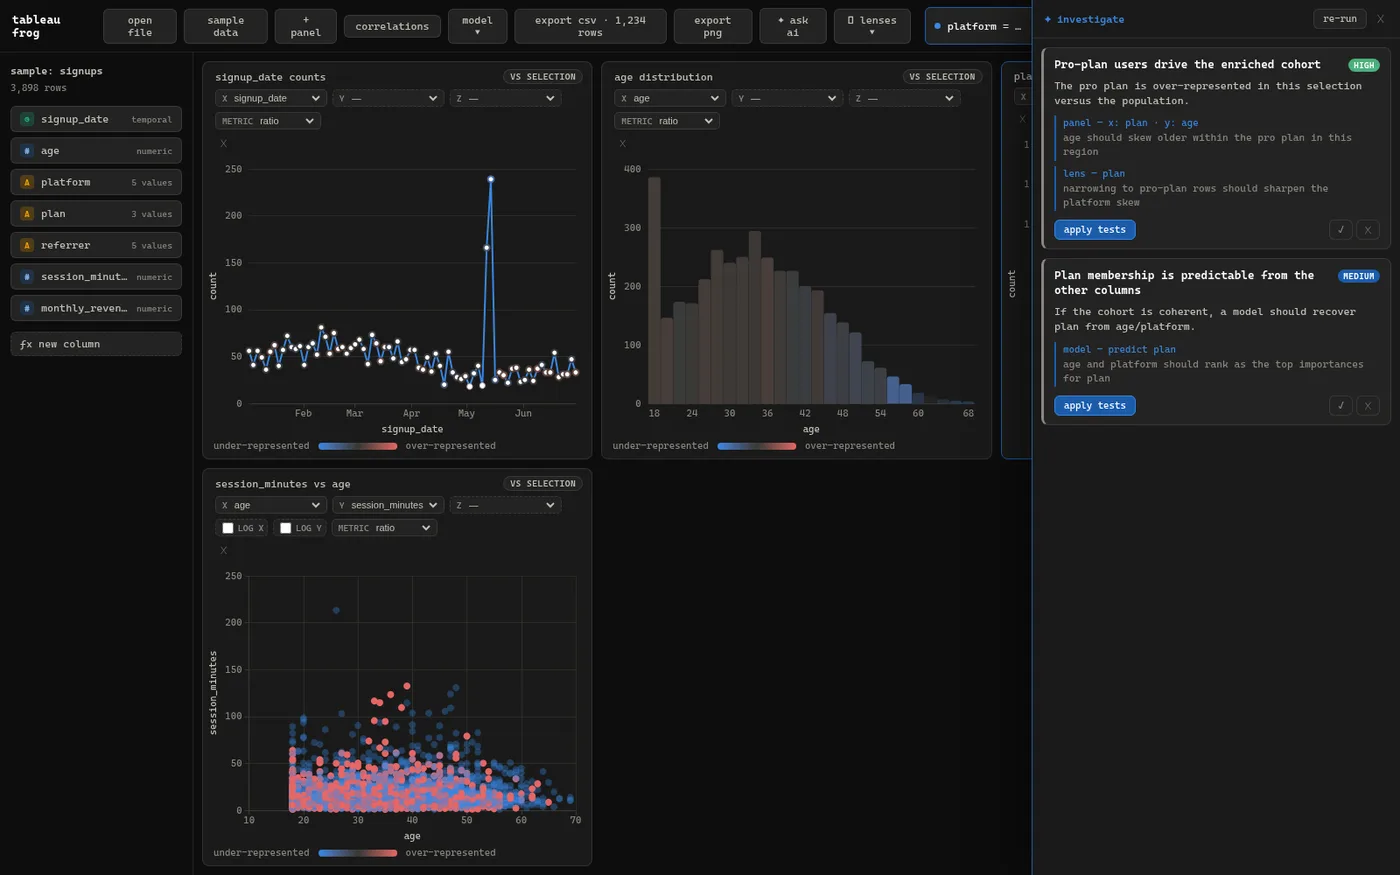
Apply the tests → confirm or reject
Each test spawns real panels tagged H1 test, edits the lens, or trains a model — applied in dependency order. The card’s border colours with your verdict; the trail is saved per dataset.
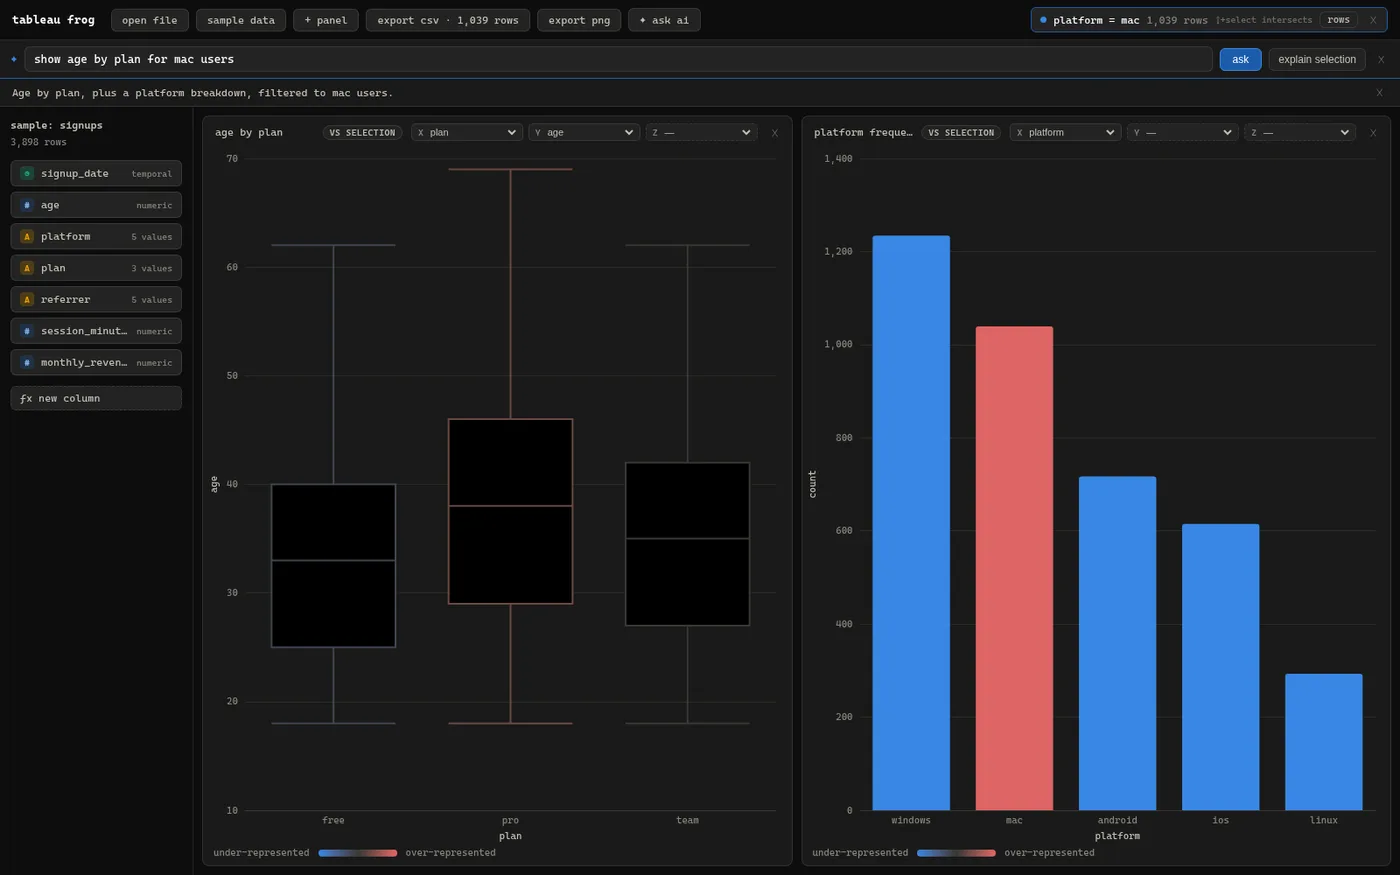
Asking for a view in words
The assistant receives metadata such as column names, types, ranges, category counts and row counts. Raw rows are excluded, but the metadata is sent to an external model. It can propose panels, selections and derived columns. An explanation is still a model-generated interpretation that needs checking against the data.
A local random forest
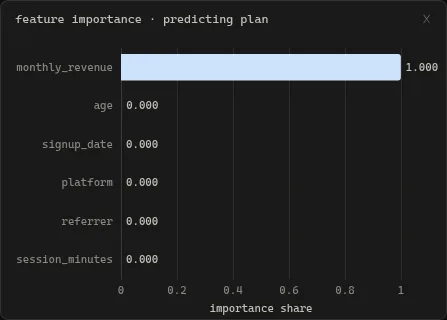
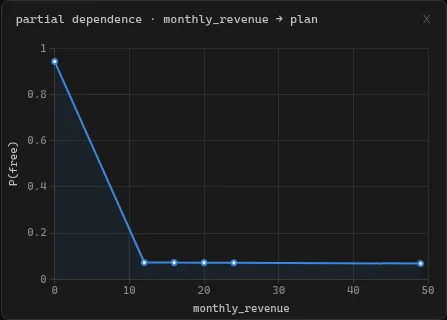
model: predict <column> trains a TypeScript random forest in the browser. Feature importance and partial-dependence views give another way to inspect relationships. This local modelling step doesn't send the dataset to a model service.
Trying other chart types
The app exposes window.tableauFrog for experiments from the console. A chart plugin can register another way to display an axis-type combination.
// claim a new axis-type signature with a chart plugin
window.tableauFrog.registerChartPlugin({
  kind: "hexbin",
  matches: ({ x, y }) => x?.type === "numeric" && y?.type === "numeric",
  create: (dataset, axes) => new HexbinChart(dataset, axes),
  buildOption: (model) => ({ series: [{ type: "custom", /* … */ }] }),
});

// …or just script the live app from the console
const frog = window.tableauFrog;
frog.addPanel({ x: "age", y: "session_minutes" });
frog.setLens({ field: "plan", eq: "pro" });
frog.deriveColumn("ltv", "monthly_revenue * tenure_months");
log(price)natural log · numeric/temporalzscore(age)standardise against the columnyear(signup_date)temporal → numeric partbucket(revenue, 10)quantise into N bucketsclamp(x, 0, 1)min/max fencecontains(name, "pro")string predicate → booleanA couple of recorded timings
Running the project
Most of the app runs in a plain browser. The Tauri desktop shell adds native file access. The source has setup instructions and notes on the implementation.
# Run the browser version locally
git clone https://github.com/xnmp/tableau-frog.git
cd tableau-frog

bun install
bun run dev            # http://localhost:1420
bun run tauri dev      # native desktop shell