Trying a different way to look at data
The idea I'm playing with is choosing the variables first and letting the app work out a chart. Then, when I select an interesting group in one panel, I can see how that group differs across the others.
Tableau Frog is where I've been trying out that interaction, along with some ways of getting an AI to help explore the data.
What stands out about this group?
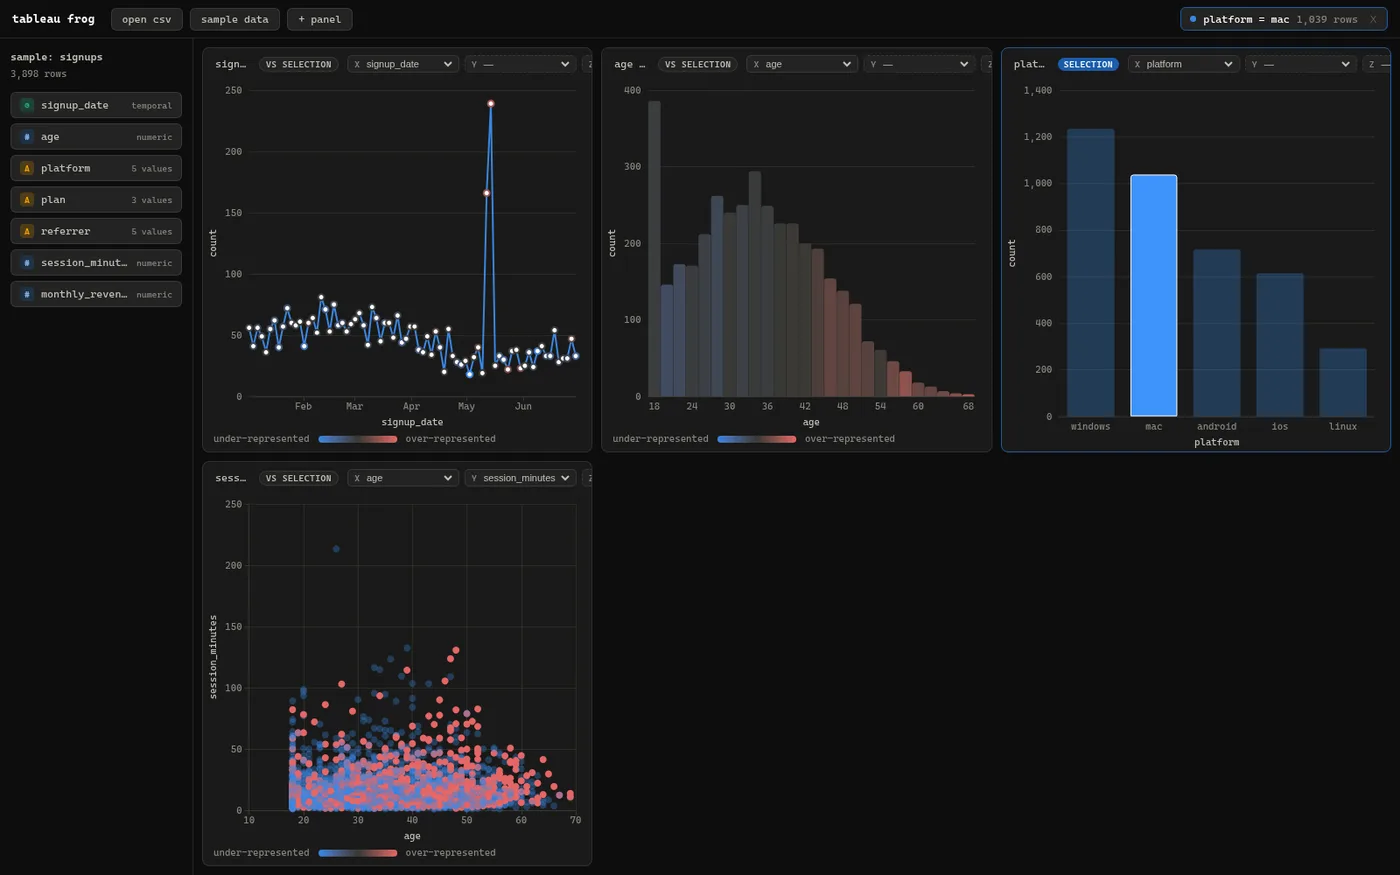
I can click a bar, brush a range or select a cell, then compare that subset with the rest of the data. Shift adds another condition. The selections are saved per dataset. A lot of the implementation work is keeping those updates responsive as the dataset grows.
Using the AI suggestions as things to investigate
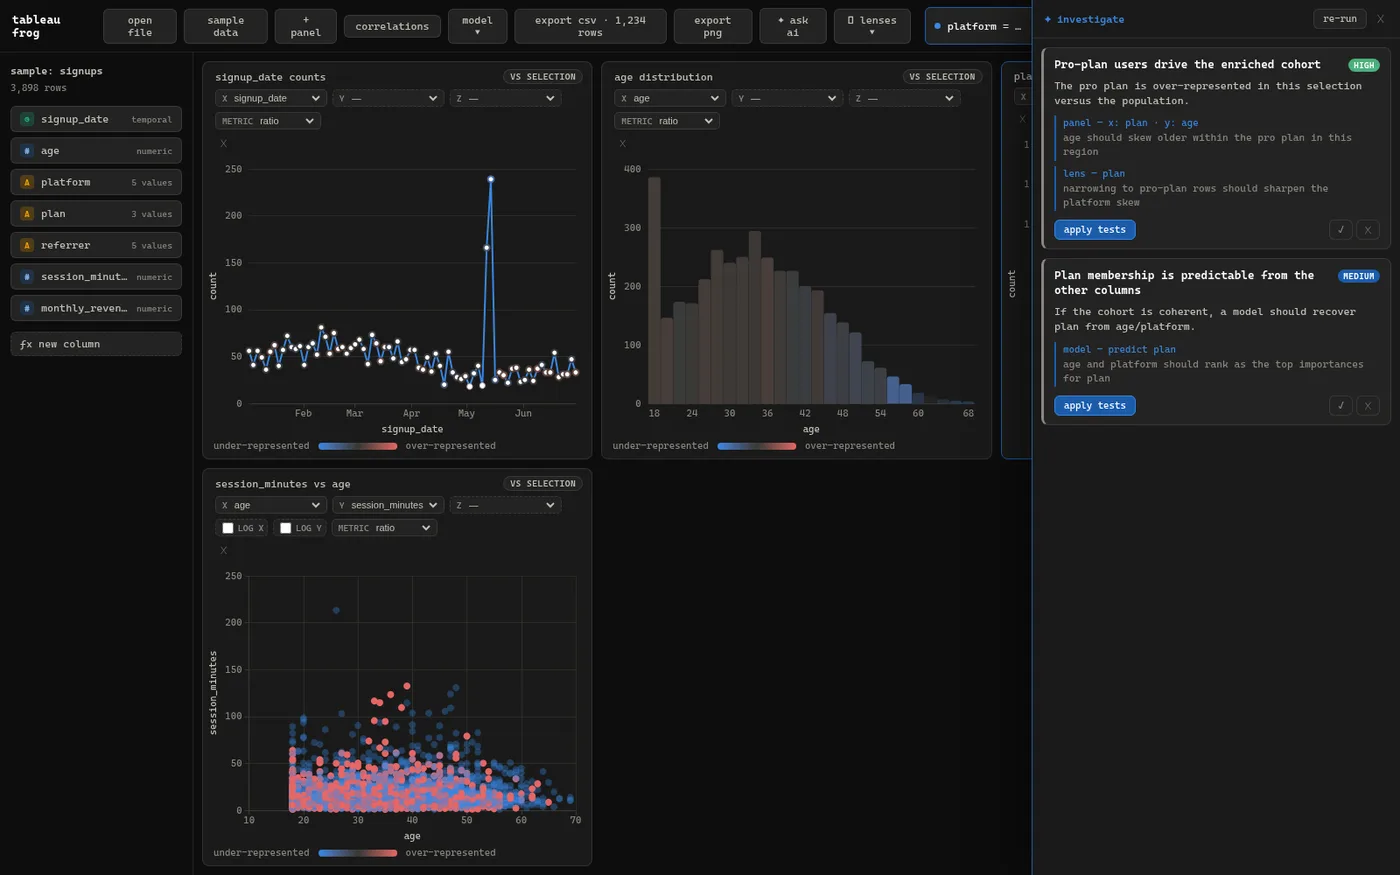
Ctrl+I asks for hypotheses about a selection. Each suggestion comes with a projection to try, and I can record whether it held up. The model receives dataset metadata such as column names, types and summary counts, rather than raw rows. That still means the metadata is sent to an external model.
A local model
There's a random forest written in TypeScript, with feature importance and partial-dependence views. It's another way to look for relationships in the same dataset.
Other chart types
Extra chart types can register through window.tableauFrog. That gives the experiment somewhere to grow without putting every chart into the core.
Derived columns
Derived columns support things like log, z-score and bucketing. The expressions are parsed, rather than passed to JavaScript's eval.
Browser and desktop
Most of the app runs in a browser. The Tauri shell adds desktop file access.
Does this make exploration easier?
Open question
I'm not sure whether muting differences helps someone read a chart, or makes the remaining colours look more conclusive than they are. Statistical significance doesn't establish why a difference exists.
Open question II
Inferring a chart saves a choice until it infers the wrong one. I still need to work out how much manual control belongs alongside that.